Updated April 26, 2023
Introduction to SAS
Statistical software mainly used for data management, analytics and business intelligence is called as SAS. SAS stands for Statistical Analysis System and it is written in C language. SAS is used in most of the operating systems. SAS can be used as a programming language and also as graphical interface. It was developed by Anthony James Barr and can read data from spreadsheets and databases. The output can be given as tables, graphs and documents. SAS is used to report, retrieve and analyze statistical data and it is also used to run SQL queries.
What is SAS?
The reason for the existence of the Statistical Analysis System is to work with data that are obtained from numerous sources. The data from various are gathered together and used to perform some sort of statistical analysis to retrieve the expected outcome. As foretold, we could use software to work on statistical analysis, but we could also make the use of the SAS programming language.
How does SAS make working so easy?
The SAS makes it very easy for an organization to work with the roughly gathered data and transform those into some useful outcomes that help the business in several ways. Here we will see how statistical analysis is used in various industries:
IT Management
In the world of information technology, data analysis is very vigorously used to design a solution based on the outcome of data processing. Information technology includes the solution delivery system which could never be possible without getting a close view of the changing trend of data.
In CRM
For any of the business, customer relationship management plays a very crucial role as it’s the only factor that leads to business development. For the businesses handling an abundant number of customers, it is very important to understand the way their customers are willing to work with the business which could be achieved by analysis
Business Intelligence
In business intelligence, the analysis makes the use of random data to get some precious information. It’s all about analysis of data which is introduced by SAS application or platforms.
In Finance management
In managing the financial data, the representatives are supposed to work mainly in the visual analysis as they are non-technical people almost of the time. SAS lets us work with either of the graphical interface or with a programming language that makes things easy for any kind of people regardless of whether they are from a technical background or not.
Estimate productivity
It let us evaluate the performance of several entities like employees, machines and so on which is later used to generate a productivity report. The estimated data are mostly proven beneficial when the requirement of data comparison is required.
Understanding SAS software environment
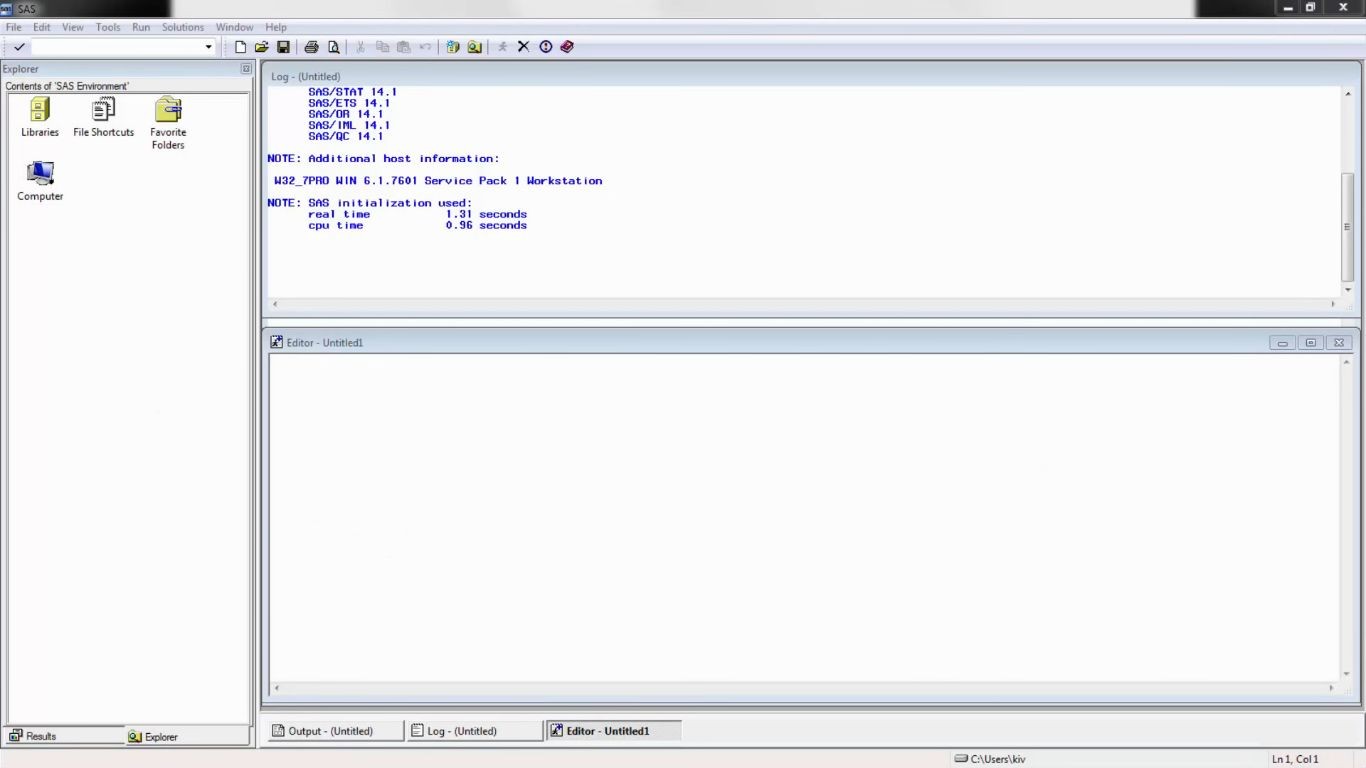
Here in this section, we will have a look at what a SAS software is comprised of. The above picture shows the SAS software screen that we get right after opening the software. Below we will see a bit of detail about all the components that we are able to see in the screen.
Log tab
The window in the picture that has some blue colored text written over it is the log. It shows all the logs that are generated while the developer writes and executes the code or program.
Output section
Output is a section that could be populated by using the tab that could be seen at the bottom of the picture. As the name suggests, it is used to get the output. This section could be used to generate an outcome for the SAS program.
Editor section
In the editor section, the program will be able to write the codes that will be used to get the expected output. It actually provides a platform to the developers to edit the code, as its name sounds. The code written over here has to follow some specific syntax that we will see.
Explorer Window
The window in the left side that consists of some folders are the explorer It has holds some of the very important folders like a library. the SAS table created could be seen under the library folder. It also stores the sample data sets which could be used to work with actual data as well.
Result Tab
As the name states, it’s the window that shows the result for a set of codes or programs that we have executed. On clicking on the result tab, it will give you the list of all the programs executed by us and choosing one, we get the corresponding output.
What can you do with SAS?
While working with SAS, it is very important to understand it’s a capability in order to make efficient use of it. It helps us to get a broad range of solution due to the functionality it offers. Below are a few of the things that we can do using SAS.
Generating graphical report
The statistical analysis software allows us to use the raw data to generate the graphical report. Due to its feature, it becomes easy to use for non-technical folks as well.
Statistical Analysis
The statistics obtained by the data processing could be used for statistical Actually it is a way to use the outcome to created by gathering useful information.
Improvement of quality
The most efficient way to improve the quality is to compare the old outcomes with the latest outcome that has been generated after amendments to make the system better. Based on the comparison result the appropriate steps are required to be taken to improve the quality of any product or service.
Perform operation research
Research is all about considering the data before making the final decision. The information obtained using SAS software helps in decision making in order to finalize the summary or output of research.
Developing application
We have seen above that the software has editor tab, the output tab, the log tab which is used to provide a programming platform. Developers can write the customized codes in the software to design the report generation according to the requirement.
Working with SAS
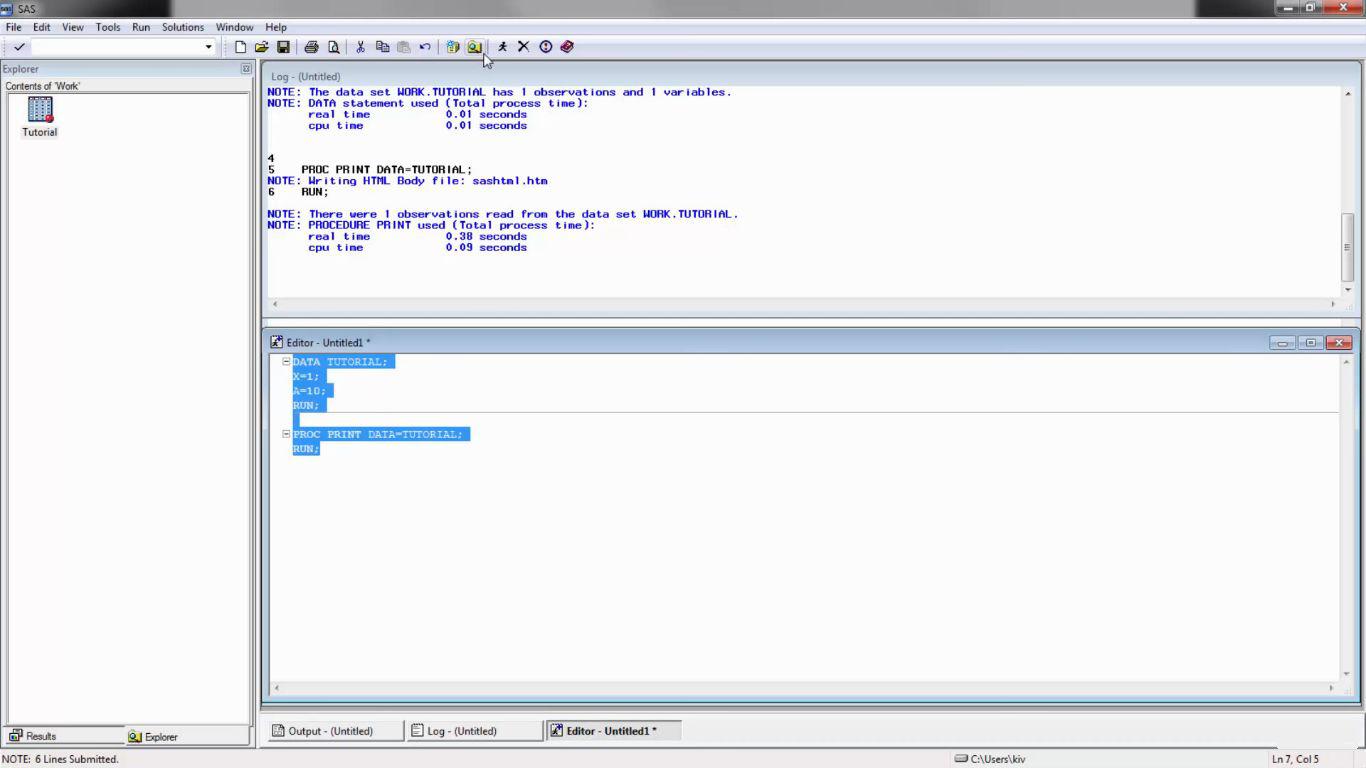
Till this section, we are totally aware of what SAS is, how it could help us and what is the purpose of SAS existence. Now we will be writing a simple program to understand how the codes are written in the statistical analysis software. To give you a precise view of the development environment together with the code, a picture has been to add. So let me do that for you. Let’s go!
Input
- The word “DATA” is the keyword and the tutorial is the name of the file that will save this program.
- Every statement written here has to end with a semicolon.
- X and A are used to store the assign the value that will be stored in the row.
- PROC is the keyword that is used in the first line after the line mark.
- PRINT DATA=Tutorial, is used to store the tutorial program in the work folder under the library folder which is in the explorer tab.
Output
- Once the program is complete just click on the run icon that is located in the toolbar at the top of the picture.
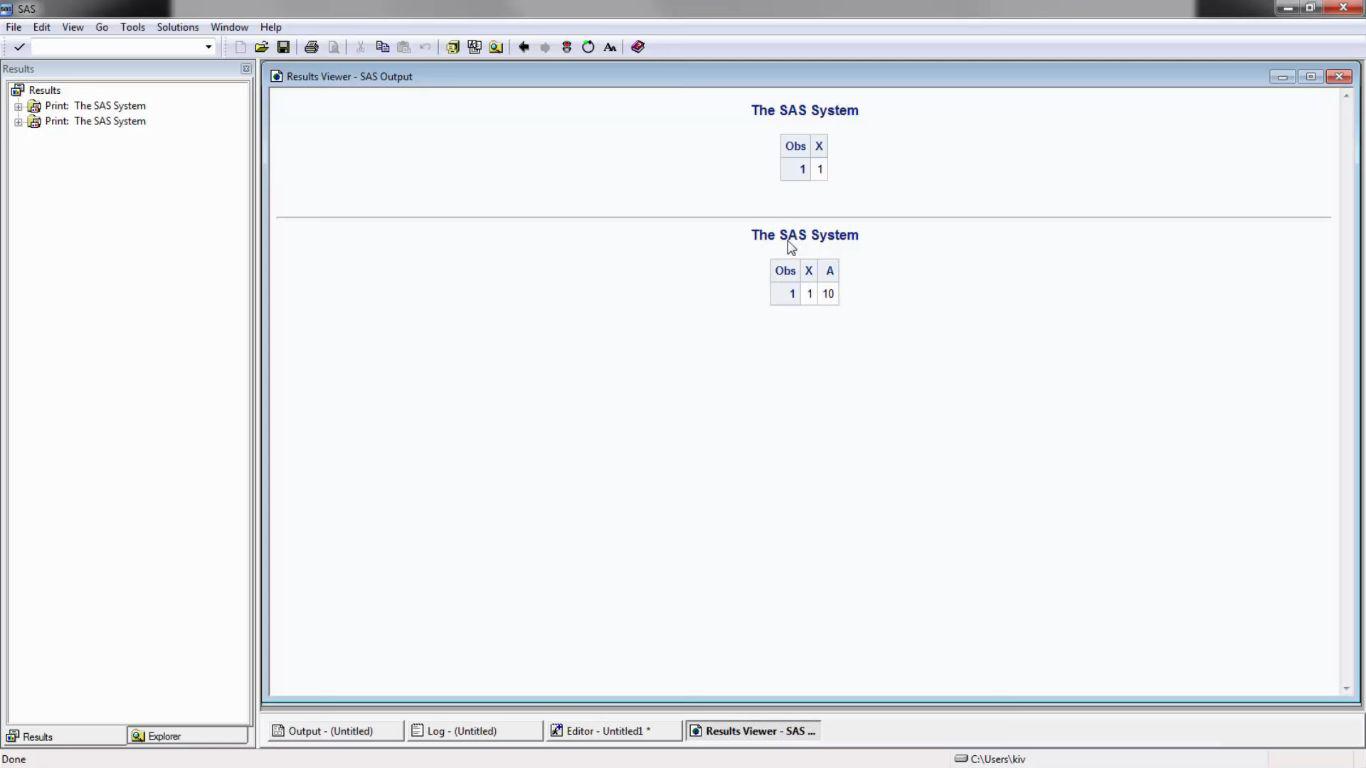
- The output shows the visual representation of the data that are included using the program.
- The output here has 2 rows and 3 columns.
- The Obs column shows the serial number here, the X and A column show the values assign to it.
Advantages
The SAS is well known due to its several advantages. Here in this section, we will be discussing some of the advantages of the SAS that makes it very useful.
Graphical Interaction
Till now we have gone through the coding in SAS but it also provides us a graphical interface where anyone one uses the provided options and it will work the same way as the written program does.
Business Intelligence
It is a must used tool in business intelligence. While processing the data, this analytics software is considered as a very helpful tool for generating information. Again, due to the simple interface, the business analyst is not required to learn to programme and it makes the work very easy and efficient for them as well.
Large data processing
SAS applications provide us a platform where we can work on millions of different data to transform into business useful information. It’s the capability to process the large sum of data at the same time gives it an edge and also saves a lot of time.
Used in several industries
The usage of this system is not limited to any particular industry. It works well in order to process data that belong to any industry. For example, it could be used in Finance with the same efficiency as it could be used in the human resource industry.
Required Skills
The good thing about SAS is that it’s not mandatory for anyone to learn any technology to work in SAS software. Any person regardless of the technical background can work with it. Though it doesn’t need any strong technical skill, knowing the things from all direction always provide the edge. The interface is very simple in the analytics software that makes it more convenient for the users to interact with.
To write a program in SAS, one must have to be aware of the fundamentals of programming. Just like other programs, the programs that are written in this software also has keywords like DATA, PROC and so. There has to be used the same way as the keywords are used in other languages. The basic understanding of coding will be many files to write your code in the editor tab.
Why should we use SAS?
In my understanding, till now you should be knowing about why you should use this system. But again to refresh your learning or to give you a heads up, we can repeat the notion again. So SAS can be used when we have a need to process the data that is available with a lot of variety and also in a very large amount. It uses the data and helps to convert it into some useful information.
Also, if compared with other methods of working with data, SAS is always preferred due to its tendency to work with the pool of data. Microsoft Excel could also be used sometimes while working with less data but when it comes on handling records of millions of customers, using their data to generate the report, SAS is the best option available to us.
Scope
The SAS is used vigorously to enhance the decision making the quality of any business. Anyone with a good knowledge of the analysis system could be a business analyst and grow their career in multinational organizations. Also, as we know that working in SAS doesn’t need any technical background, anyone who doesn’t want to learn technical things but wants to work in management could choose statistical analysis as their mainstream.
Who is the right audience for learning SAS technologies?
This is a hypothetical question and totally based on what a person wants, knowledgeable and willing to learn. This system is open for all kinds of people regardless of their technical background. If someone wants to work in data analysis then they can make the use of the simple graphics interface in order to process data.
While someone who has programming skills and uses to develop their customized analysis solution. This system gives the opportunity to a broad set of people to work with it. Also, those people who have worked in other technologies and now want willing to switch in this system can also be a part of it due to the simple interaction interface it has. It simply makes the work very easy for all of us.
Conclusion
The SAS provides a very easy mechanism to work with a huge amount of data. SAS software is available in the market that helps to implement this system. It’s the best feature to transform the raw data into useful information which could be represented visually, which makes it the best option to work with.
Recommended Articles
This has been a guide to What is SAS. Here we discussed the working, definition, skills, and advantages of SAS. You can also go through our other suggested articles to learn more –


