Updated April 17, 2023
Introduction to Matplotlib in Python
Matplotlib is an open-source library that aids in graph plotting. It was initially written by John D. Hunter, who happened to be a neurobiologist. He authored Matplotlib at the time of his post-doctoral research in Neurobiology. The aim of this library was to study the activities occurring in the cerebral cortex of patients suffering from epilepsy by plotting these activities in a graph. The sole purpose of plotting graphs was for better visualization and for studying the common patterns in them. The first release of Matplotlib was in 2003. Over time, Matplotlib became one of the most extensively used plotting libraries alongside the Python programming language for data and computational graph plotting. It is platform-independent and can be run on Windows, Mac OS, and Linux.
Understanding
As a Python library, Matplotlib facilitates one with 2D plotting capabilities for visualization. Matplotlib is used along with other open-source libraries such as
1. NumPy
The term “NumPy” stands for Numerical Python extension. This library provides several mathematical functions to work with larger and multi-dimensional arrays and matrices. It can also hold data of arbitrary data types and be easily integrated with many databases. To use numpy in your project, make sure to import. For example, import numpy as npy.
2. SciPy
It is built on top of the NumPy array; the underlying data structure is an object array provided by the NumPy module. It provides functionalities such as image and signal processing, specialized functions in linear algebra and interpolation. One can add the SciPy module to their project using the statement: import sciPy as sp.
3. IPython
An abbreviation of the term Interactive Python. It is an enhanced interactive Python shell that supports mathematical expressions, inline plots, etc. It also helps integrate with SciPy stack libraries. In addition, it comes with a complete setup making interactive plotting easier.
How to make working with Matplotlib easy for Python developers?
As a python developer, one should be making use of the Pyplot module within the matplotlib library. Pyplot is an Application Programming Interface that consists of functions/ methods which help process data for visualization. The plot is quick when it comes to generating visual graphs. In addition, its similarities with Matlab make working easy for individuals who have prior experience working with MATLAB and vice versa.
How can one work with Pyplot in Matplotlib?
In order to be able to access pyplot methods, one needs to import it in their python file. This can be done by including the below line at the top of one’s python file:
import matplotlib.pyplot as mypltExample #1
import matplotlib.pyplot as myplt
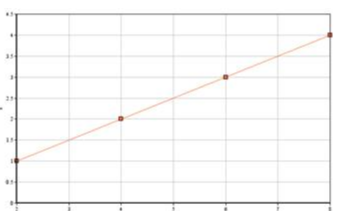
myplt. plot([2,4,6,8] , [1,2,3,4])
myplt. show()
In the above example, the plot() method takes in the X and Y-axis coordinates, respectively, and plots a graph accordingly. The plot() method can also take in an optional third argument that determines the color string and type of the line plot. By default, it is “-b,” which displays a blue line. Other methods such as xlabel() and ylabel() allow us to name our axes.
Example #2
import matplotlib.pyplot as myplt
myplt. plot([2,4,6,8] , [1,2,3,4])
myplt. xlabel(‘time in mins’)
myplt. ylabel(‘distance in Kilo meters’)
myplt. show()
Types of plots in Matplotlib In Python
Matplotlib provides a wide variety of methods and functions to generate different types of graphs.
Let us have a look at a few of them:-
- Line plot: This is the simplest of all graphs. The plot() method is used to plot a line graph.
- Subplots: The subplot() function is used to create these. It is very useful to compare the two plots.
- Images: Matplotlib can also create images with the help of the imshow() function.
- Histograms: To generate histograms, one can make use of the hist() methods.
- Paths: Arbitrary paths can be added to Matplotlib with the help of the matplotlib.path module.
- Bar Charts: The bar() function is used when plotting bar charts. One could further customize the bar charts as horizontal or vertical as per one’s requirement using this method.
- Pie Charts: One should be using the pie() method to generate pie charts. Additional features allow one to use shadow effects on the pie, label the regions, determine the percentage it represents, etc.
- Tables: The table() function lets one add a table for systematic data categorization.
- Scatter plots: To generate a scatterplot, the function scatter() is put to use. One could also make use of the optional size and color arguments this function has to provide.
- Filled Curves: The fill() function allows one to plot filled curves and polygons.
- Log plots: Functions such as semilogx(), semiology() and loglog() makes it easier to plot graphs that involve logarithm functions.
- Polar plots: For generating polar plots, the polar() function is used.
- Date Handling: Matplotlib lets one easily plot time series data with any hassel.
- Stream plots: These plots are meant for the plotting of vector fields. The function streamplot() is used to achieve this.
Advantages
Below are some of the advantages explained.
- A few advantages of Matplotlib are
- Simple and easy to grasp for beginners.
- Easier to use for people who have had prior experience with Matlab or other graph plotting tools.
- It provides high-quality images and plots in various formats such as png, pdf, pgf, etc.
- Provides control to various elements of a figure such as DPI, figure colour, figure size.
How will this technology help you in your career growth?
With the rise in demand for data analysis and data science, tools such as matplotlib are required to be used to study the behavior and pattern of data. As of today, Python dominates the industry when it comes to data science and analysis. For someone familiar with python, having knowledge of libraries such as that of matplotlib will help one grow professionally.
Conclusion
This article shows how Matplotlib came into existence and various other libraries it is commonly used with. It also covered a few of Matplotlibs well-known functions for plotting various graphs and customising them as per our requirements.
Recommended Articles
We hope that this EDUCBA information on “Matplotlib In Python” was beneficial to you. You can view EDUCBA’s recommended articles for more information.


